Stuff about Data, Tableau and Visualisation
 
Category: <span>Data Visualisation</span>

When can a line be a bar?

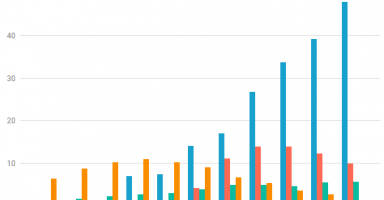
When you work in Data Visualisation, there is no way around bar and line charts! They are arguably the most fundamental and versatile graphs out there. They are so versatile that Tableau’s Andy Cotgreave formulated a law around them: The longer an innovative visualization exists, the probability someone says it …

Everybody’s a Hacker

  This post is based on a presentation that I originally created for the Auckland Tableau User Group (#AKLTUG) in December 2016 and then extended for the Tableau Fringe Festival APAC (#TFFAPAC) in August 2017. It’s best consumed as what it is: a talk! So I encourage you to watch …

r/IsDataBeautiful?

Stephen Few recently published an article titled “Data Is Not Beautiful”. Apart from the title, which is an obvious reference to the subreddit r/DataIsBeautiful, Randal S. Olson (one of the Moderators of the subreddit) also mentioned that they were in discussion with Stephen to do an AMA (ask me anything) but …