VizIt Sydney 2023
Agenda You can add the whole agenda to your calendar through this link: VizIt Google Calendar
Hello there! You are likely here because you watched a presentation of mine and are curious about the resources I talked about. If that’s not the case, don’t worry, you are allowed to follow the links below anyway! If you want to get in touch with me, you’ll find links …
This year’s Tableau Conference is over; 8,000 people are back home and most of them are hopefully inspired and energised or have at least learned some valuable new thing about Tableau and data. For me it was the 3rd Tableau Conference I attended and the 3rd time I fully self-funded …
This is a summary of my presentation at TC23 of the same title, while it was prepared for a Tableau event, it is entirely tool independent; in fact all aspects of it apply similarly to any other solutions you would want to design, websites, apps, products, etc. Below you’ll find …
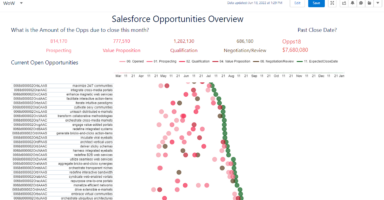
I do enjoy a good challenge and recently the PreppinData and WorkoutWednesday teams joined forces in a challenge that was based on Salesforce data. This was the perfect setup to take Salesforces native analytics engine (CRMA fka. TCRM fka. Einstein Analytics) for a spin to see what is possible. To …
At work I recently was asked about resources to learn design principles for data visualisation. I offered to provide some, but when I started looking into it, I realised that there is likely not just a few resources that teach you the basics. There are tons of them, focusing on …
I co-lead a Tableau User Group and may refer to Tableau or TUGs, however these learnings are applicable for any event independent of subject matter or location. Slowly but surely more and more countries lift restrictions on in-person gatherings. For us as User Group organisers that means we will need …
This post first appeared in the Data Visualization Society’s Medium publication “Nightingale” as part of their “Data Sensification” series. The content is the same with the exception of a little update at the end. In the beginning of 2020 I decided to attempt using LEGO bricks as a map-building material …
The (not so) new parameter actions in Tableau introduced the possibility for much more interactivity and navigational elements. For this weeks #MakeoverMonday, a friend asked me if it was possible to select one item in an ordered bar chart and display the 10 items just above and below it dynamically. …
Most of us are supposed to stay at home anyway these days and even if your country doesn’t enforce a complete lock-down, chances are that in person events like User Groups are currently not happening. The Tableau Community (and Tableau) stepped up to address this and make the best out …