Ever since one of my contacts at Tableau mentioned Project Maestro, I was keen to get my hands on it to see how data transformation can – hopefully – seamlessly be integrated with data visualisation. Now, since the first beta versions have been released I wanted to write down my initial thoughts as somebody who uses Tableau and Alteryx regularly and is familiar with the challenges they pose for users. Project Maestro is in its 2nd beta version at the time of writing and I would describe its functionality as “basic”. Nevertheless, it has some interesting characteristics which demonstrate the path Tableau tries to go with this product and position it very well for what it is supposed to be.
 One of the few trends which exists since the beginning of calculators, is the concept of abstraction. Humans don’t want to deal with the nitty-gritty of systems, they want an easy and convenient way to tell a system what to do. From the abacus which replaces the ability to calculate with the ability to count pearls on a wire, to virtual environments where you don’t have to worry about your hardware any longer; abstraction takes care of lower level details, for us to spend more time learning and doing more productive things. That said, it is important to note, that it usually doesn’t leave us without other problems that we can shift our attention to.
This observation also holds true for programming, from punch cards and assembler code to higher level programming languages, abstraction took away the more laborious tasks of making the machine understand what we want it to do. With tools like Informatica, SSIS, Alteryx and now Maestro, even the need to write code disappeared at least in part and “development” moved more and more into the business domain…at least theoretically. (It even moved into the personal space, considering services like IFTTT and how people, who wouldn’t have a clue about conditional programming, use it.)
The self-service analytics promise
Alteryx, the “Leader in self-service analytics” promises to deliver “analytics” to the business user, a group of people who has little technical background and therefore potentially profits a lot from further abstraction; it empowers them to do analytical tasks by themselves rather than relying on the IS departments with their week or month long development cycles. If I was to define requirements for such a tool, it would need to:
- require little to no background knowledge
- have clean user interface
- provide easy interactions to explore the data
- be extendable to do more complex tasks if needed

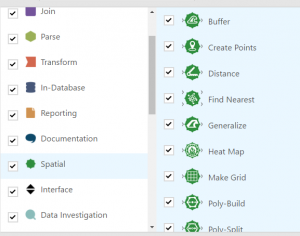
Alteryx certainly excels at the amount of features you have. It is very granular and piece by piece you can build up more complex functions, which is great if you have a technical background but not enough experience to write it down in code at the same speed. It does however completely overwhelm anybody who doesn’t breathe “data”. How do I do a left join? Why do I end up with fewer records and where did they go? Do I have NULLS where I don’t expect them? All of these questions can be answered within the tool but they need some technical understanding and in-depth knowledge of the tool to figure out those answers.
As long as you have a conceptual understanding of what is happening and you don’t do mistakes, everything is fine and while some things require the combination of several tools, there is always a way to achieve what you require. As soon as you need to maintain or troubleshoot your (or even worse somebody else’s) workflow though, it becomes a laborious task of dragging filter, sort and browse tools to various steps in order to identify a bug or to understand a certain behaviour.
- require little to no background knowledge – only for the most basic parts
- have clean user interface – alright user interface, horrible configuration windows
- provide easy interactions to explore the data – nothing apart from a tabular view without sorting
- be extendable to do more complex tasks if needed – extensively extendable with scripts and macros
I personally like Alteryx for my use cases, rapid development and prototyping of ideas and quick and dirty transformations for ad-hoc problems where my coding skills wouldn’t achieve a fraction of what I do in Alteryx in a similar time frame. I can make it do pretty much anything and if something changes I can react to it quite quickly. And while I never met an IT person that had problems understanding how to use it, I met various business users who were confused as to how to utilise it in an efficient way and how to translate their business problems into workflows. It just requires too much technical knowledge to use it properly to be a pure business tool for people who don’t have a general understanding of data transformation processes.
The Tableau answer

Tableau took on this challenge with Project Maestro took on this challenge and delivers on the foundations which the developed with Tableau Desktop: Visualisation and Exploration!
I drop tools in my workflow and at any point, I can see
- what certain join types do and if I end up with more or less records
- which fields end up being unioned and which ones don’t have a match
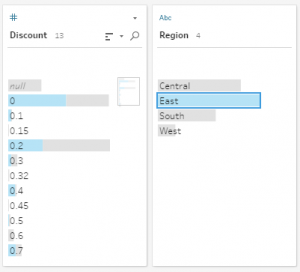
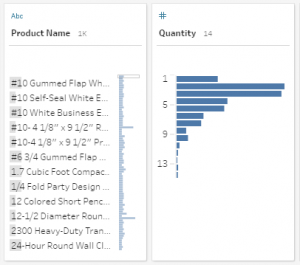
- the distribution of my values and whether it’s my expected result or something went wrong
- where my NULL values are coming from by just clicking on them
I don’t have to rerun and wait and if I feel the need to deep dive into a certain aspect of my data, I can do that with one or two clicks.
It makes data exploration intuitive and doesn’t require me to step back into the development process to correct something. And if I want to, at any step I can open my data set in Tableau to do a more detailed analysis.

- require little to no background knowledge – mostly
- have clean user interface – very simple and intuitive
- provide easy interactions to explore the data – intuitive click to highlight/filter
- be extendable to do more complex tasks if needed – partly through calculation, lacks the possibility of implementing complex features
As I said in the beginning, it’s an early beta. In terms of functionality it only delivers features which are already available in Tableau (Pivot, Join, Union, Aggregate) and makes them available for the preparation. It connects to many data sources you are used to from Tableau and you are able to create calculated fields with the same editor. If you are used to Tableau, working with Maestro will be effortless. Initially the number of tools might look disappointing, however after looking through some of my most used Alteryx workflows, I can replicate nearly all of them already in Maestro, with the one big disadvantage: I cannot write back to my data bases.
An Alteryx killer?
For playing around with data sets which will end up in Tableau anyway and the kind of transformation which would usually be done in Excel, Maestro seems to be a good alternative; if it is priced reasonably, especially people who tried to avoid the hefty price tags for other tools might be interested to give it a go. I will try to use it more regularly in the coming weeks to see how it actually performs in real-life situations.
For complex workflows, productionised data transformations and anything that includes geo-spatial analysis or more unconventional problems, Alteryx will stay the tool of choice for me and I wouldn’t expect this to change in the near to medium term future. Especially the ability to read from and write to nearly any data source makes it incredibly versatile, so it would be interesting to see if Maestro moves this way at all in the future or just focuses on the Tableau ecosystem.
The approach I can see for now seems very thought through and I would hope that the minds behind it come up with other innovative and intuitive solutions to everyday problems.


