


People sometimes have weird ideas. This was definitely one of them. I didn’t even set out to build a LEGO map of New Zealand…it just happened.
In January this year I was working on something completely unrelated, based on a quick map I did a bit earlier. I had created a map in Tableau but reached the limits of the tool and was looking for something else. Very quickly it became obvious that QGIS would be the tool of choice for what I wanted to do. I cannot remember the details but at the same time I figured that my original viz looked a little bit like LEGO – and there it was.
With the #30DayMapChallenge just finished, I had seen a bunch of LEGO style maps but it sounded like an interesting idea to build an actual map in LEGO.
I also thought that I had seen a map in LEGO before. A quick search brought up Dirk’s world map in LEGO.
The Planning
The first thing I realised was that QGIS was way clunkier than I would have hoped for; that paired with my close to non-existent knowledge about GIS tools caused some frustration. I knew what I wanted to do but I didn’t know the terminology to look for help.
It took me 10-15 hours over a weekend to figure out the basics and to get to a point where I had a first draft of an elevation raster for New Zealand. At that point I definitely jumped the gun (more on that later) when I started building the whole model in LEGO stud.io, a piece of software that lets you build virtual LEGO models.
The benefit of actually building something was that I ran into a bunch of questions I hadn’t thought of before. A 2 dimensional version is rather simple, with a third dimension I needed to think about how I want to layer the different colours. How do I make the whole thing stable? Do I start on the lowest layer and build up or do I have my baseline in the middle and build down and up? And how the hell would I hang it on a wall once it’s done?
I got in touch with Dirk who build the world map and he happily answered some of those and a bunch more questions. By the time I felt like I knew how I wanted to do it, I didn’t like my initial QGIS work any longer though..


The Questioning
I’m a data person, which probably doesn’t come as a big surprise…This project is a data visualisation of sorts and to be happy with it, I had to be confident it represents the data in a way that makes sense; to me and any other audience.
So let’s see:
Scale: Each stud (the technical term for one LEGO square) represents 10km in the real world. This results in a scale of 1:1250000. I am happy with this, although I did create patterns for 12km and 15km squares because I questioned whether 10km would fit on our wall…In the end I did it anyway.
Colour palette: This was basically just verifying that Dirk’s work would work for me. The colours are a version of a standard colour scheme for elevation maps, which go from green to yellow to brown and white. Although there are discussion about how suitable that is (low areas do not always have green vegetation, etc.) I think that most people will be able to relate to it. Also, the colours Dirk chose are some of the more common LEGO colours which helped keeping the whole project within “a” budget. (more on that later as well).
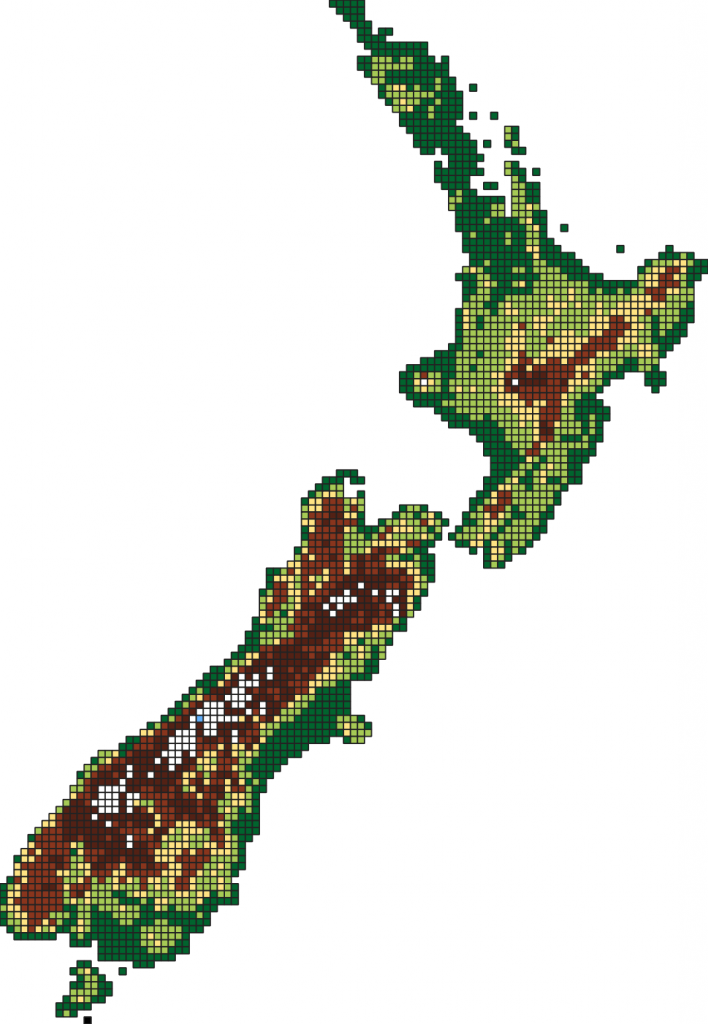
Elevation value: Since each square needs one colour, I have to find one elevation value that represents that value. I started with the median of all values within a 10×10 square. The problem with this was that it ignores outliers (as medians do). I needed to have Mt. Cook (the highest peak in NZ) visible on the map and if I used the median, it wouldn’t show up. It would also “blur” everything so that there wasn’t a lot of difference in elevation. I tried the maximum value in each square and that worked better. It made the high peaks visible but neglected the deep valleys that exist on the South Island. I ended up going through it manually to adjust values. This helped to make for example Arthur’s Pass visible and made Marlborough Sound look more like a sound.
Elevation bins: This one was the most technical problem and one I didn’t find a clear answer for. I had my colours defined by how do I ramp them to 1. not break any mapping rules and 2. have the elevation represented in a relatable way. If I create equal bins based on percentiles, all high peaks disappear. If I divide the range of elevation by the number of bins, all the lower elevations blur into one. I ended up manually defining them as 0m-250m, 250m-500m, 500m-1000m and then 500m steps. This worked well to give a good impression of the NZ landscape.
This whole process actually took the longest time. I build 3 different base maps for 3 different scales, researched mapping best practise and still learned how to use QGIS but eventually I settled on something I was happy with
The (virtual) Build
Projects like these, are only possible because somebody put in a lot of leg work before. Stud.io s a virtual LEGO builder, which has (virtually) every brick every produced by LEGO and all of the possible colours. You pick a brick one by one and stack them on top of each other to build whatever you desire. It then integrates with bricklink.com, an online marketplace where people sell their LEGO brick by brick, so once the model is finished, it only takes a few clicks to order the bricks you need (in theory!).
In total I built my map around 3 times virtually. I got quicker with each time but it’s still a ton of work! For my first build, I had no regard for the economy of LEGO. Since it’s a marketplace, there is supply and demand and since it’s not run by LEGO themselves (well, nowadays it is, since they bought bricklink) there is limited supply. You can buy single bricks for $20 if they were only produced for one set or you get them for a few cents. Also, some bricks just don’t exist in a certain colour.
I also wasn’t quite sure how to layer the bricks to get the land to actually elevate. I could have just layered LEGO plates in each colour on top of each other. While this would have been the most stable way, it also was likely to get much more expensive. I decided to mix between plates and bricks, which also allowed me to use cheaper colours as a filling under the actual colours. So I ended up getting a lot of red and white bricks which are not visible at all, just because it was more economic.
With each build I got more sophisticated and for the last one, I had a table with all the bricks I might need, their average price on bricklink and the average price per stud. You can imagine that buying eight 1×1 bricks is probably more expensive than one 2×4 brick. After a lot of manual sifting through the bricklink catalogue I created a palette with the bricks that I found affordable and started building.

Stud.io lets you build virtual LEGO models 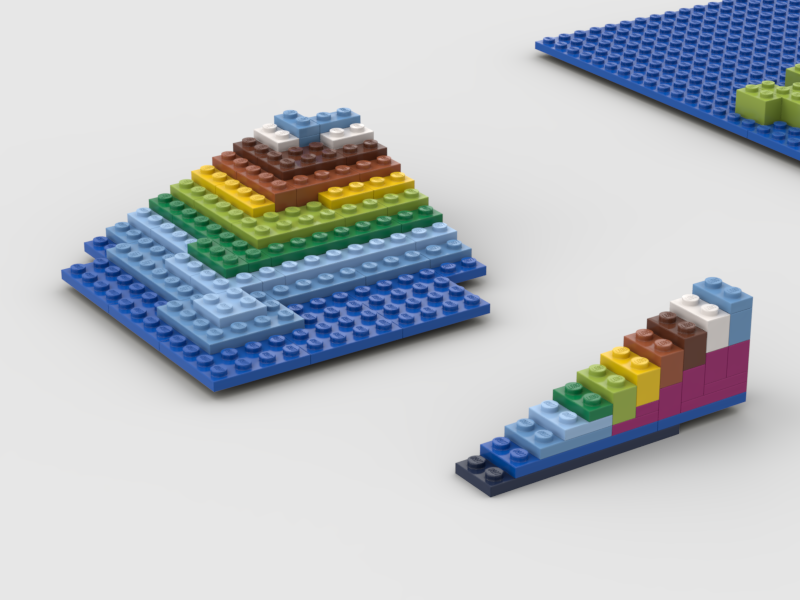
A test rendering of how to build the elevation 
The finished digital map 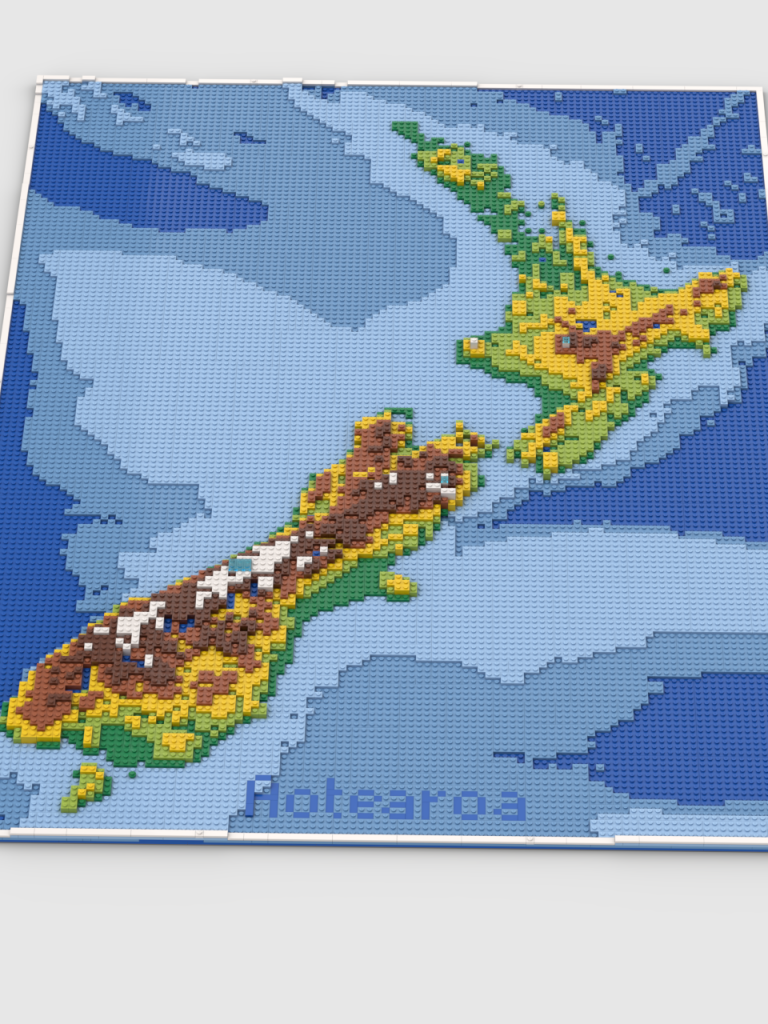
A rendering of the digital map 
Some details rendered
The Order
Now I said Stud.io integrates with bricklink, which means I can export the list of parts I used and order them on the website. Bricklink even offers to go through all available shops and pick the cheapest parts. However it does not take into account shipping fees and/or thresholds after which shipping is free. Also, in New Zealand there is limited amount of shops available. I can’t complain but especially larger orders of more obscure parts can get either very expensive or they might not have the necessary quantity available. I spent another 10-15 hours structuring my order to consolidate them in as few orders as possible to reduce shipping cost and to take advantage of cheaper prices where possible. Since my family is in Germany, I also had the option to place several orders in Europe, pay for local shipping and then have my family send them over in bulk, which made the shipping much cheaper. In total, all of this probably made a ~500NZD difference at the end. I am quite certain that I could have reduced the price further had I realised that the automatic conversion from Euro to NZD might not have been in my favour…
Anyway, I order around 3800 bricks in 12 orders. Following that, some of the stores didn’t have all the bricks in their inventory and I had to source them somewhere else AND the whole world struggled with COVID19, so even though my family sent the bricks before most of the flights where canned and countries went into lock-down, I wasn’t sure I would receive all the bricks any time soon.
The (physical) Build
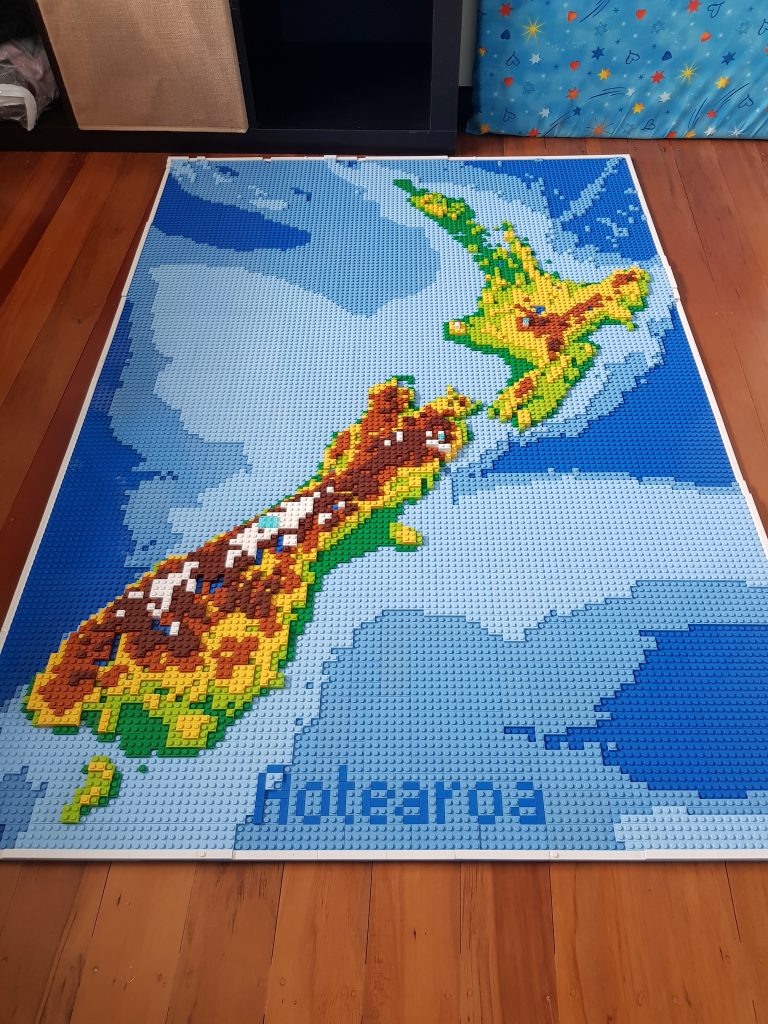
Turns out I didn’t have to worry and my bricks were delivered in a reasonable timeframe. I spent some time sorting everything by colour to make it easier for myself, then I set myself up in the spare bedroom and started building. It turned out it was easier than I thought. I had to work around a few errors in my digital models which was fine and I even ended up with a bunch of spare bricks (at the same time I was missing a bunch of bricks that I thought would have been included in my orders).
Now I have a 7.8kg LEGO map in my spare bedroom that waits for the lock down to end so that I can buy material to hang it in my living room.
| Hours of work | ~100 hrs |
| Number of bricks | ~3800 bricks |
| Dimensions | 90cm x 128cm x 3.3cm |
| Weight | 7.8 kg |
| Scale | 1:1250000 |
Final thoughts
It turns out I am definitely not the first one to approach a project like this. As I mentioned before, Dirk built a world map, as well as a globe. Dan Harris built a map of Scotland and just a few days back, somebody in NZ finished a map of Westeros.
It looks like I found a much simpler way to create a map like this than Dirk, while at the same time probably spending as much time as he did anyway. There is an R package (of course there is) which converts an image into a mosaic of LEGO bricks. With a bit of scripting the whole process could – in theory – be automated. However even if it was automated, there is still the problem of brick prices and availability, which means you might save time if you do several different maps but pay a premium for bricks.
I am very happy with how the map turned out. In one of my virtual builds I actually included a legend and lat/long markers in the frame, however I decided against it, since the main audience is myself (and I know the details) and although maps usually come with legends, it felt like it cluttered it too much.
Now I am keen to see what else I can build in LEGO and how other data points can be “physicalised”.
If you have questions or comments, if you want to build your own LEGO map or if you know other examples, get in touch and let me know! Thanks!
Update
The map got a bit of attention, so by now you can read about it in the NZ Herald and I talked to Adam on his “Project Geospatial” podcast, which is on Youtube and Spotify
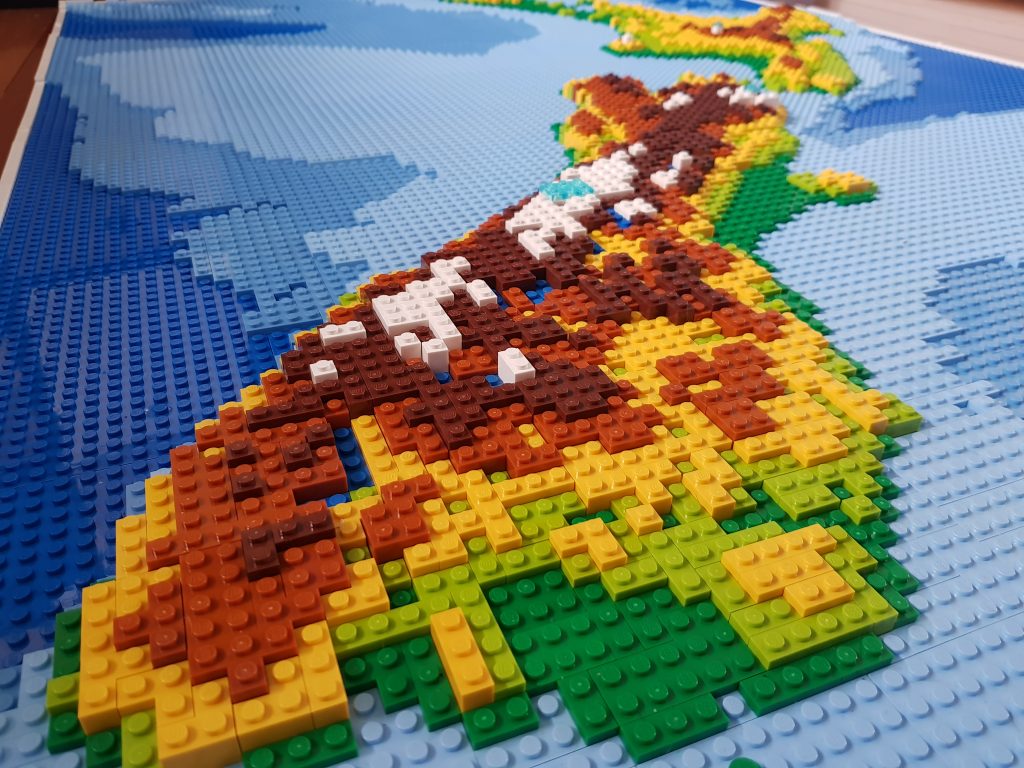
Southland 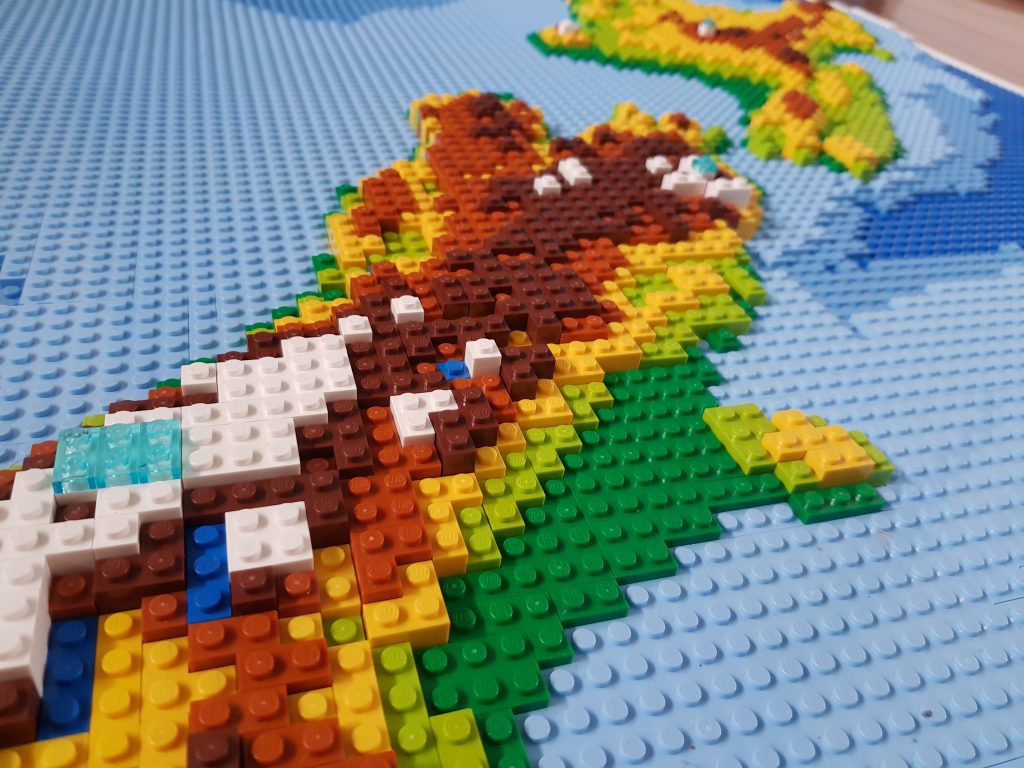
Canterburry 
Cook Strait 
North Island 
Taranaki and Ruapehu 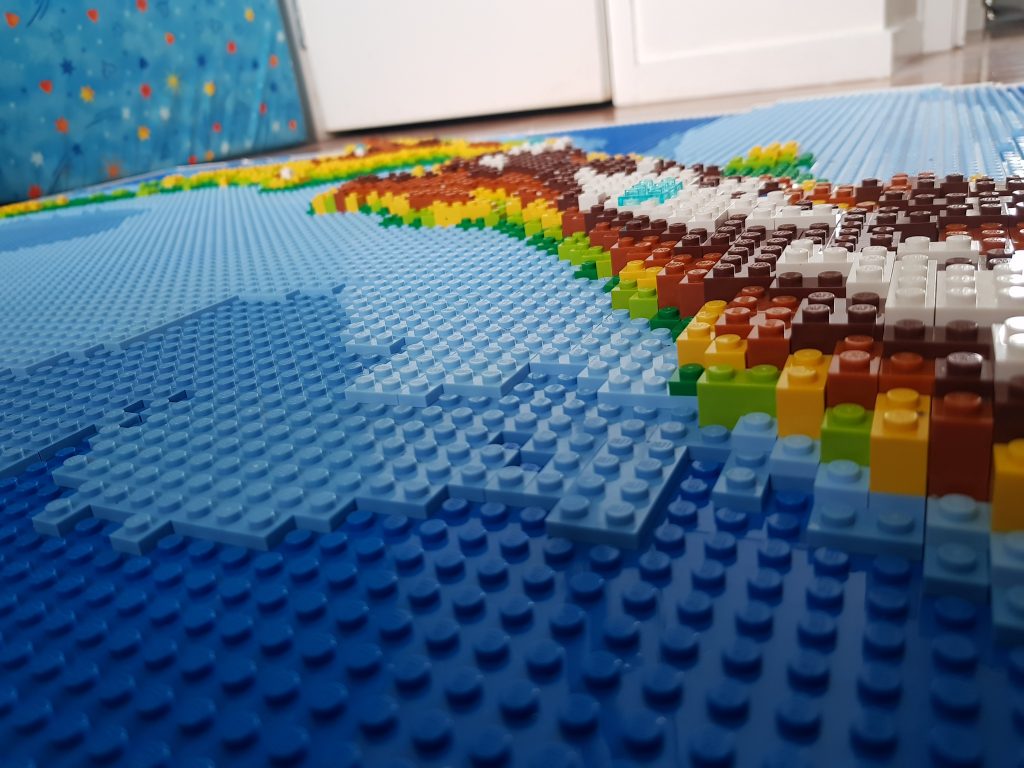
West Coast
Hi Alexander,
As a Lego fiend and former GIS professional I just absolutely love this. Could.you please send me the studio file and brick link parts list as I’d love this on our home!
This looks great. Love It!
Wow, thsis is amazing LEGO art. 3800 brics and 100 hrs, great job!
Pingback: Pixel Maps in Tableau – COOL BLUE DATA
Pingback: Building Physical Maps…with LEGO - Curvediscussion
nice
thanks!
How did you go placing this on the wall? So keen to give this a go!
I didn’t yet 🙂
I was looking into attaching it to a wall but since I rent I didn’t want to drill holes in the wall.
Literally last week I started building a wooden frame to attach against the wall and hang it off but that’s now in a workshop where I cannot access it atm 🙁
Will update the post once I do have it on the wall.
Hi there – I was wondering if I might be able to have a chat with you about using one of your photos for a NZ Facebook Lego group? Would you be interested in having a chat about this?
Sure thing. I’ll send you an email.
I saw Dan’s map od Scotland a week ago. Both are amazing! Lego bricks are perfect, these colors… Nice! Did you use glue? Is it possible to hang the map on the wall?
I didn’t use glue, mainly because I didn’t think that using glue is appropriate for use with LEGO 🙂
With the large sand coloured baseplates in the back it’s actually very sturdy and I do intend to hang it when the lock down is over. My biggest challenge at the moment is making it hold on plasterboard 🙂
Wicked!
As a fellow Kiwi, being able to build this would be stunning. Would you be willing to share the stud.io file for the model so that others could build it? No worries if you don’t wish to – I figure it can’t hurt to ask.
Regards,
David
Thanks! I would probably need to go through it once more to fix the problems I found during the build but in general – without having put a lot of thought into it – I don’t see a reason not to share it.
I would love to build this as well!
Earthquaaaaaaake!!!!!
😉