


Tableau Prep has quite a bit of overlap with Tableau and implements many of the features in a more visual way (joins, unions, etc). One feature which people initially might struggle to wrap their head around but is used all the time once they do is Tableau’s Level of Detail calculation (LODs). In Tableau Prep there is (currently) no possibility to write a LOD but their is an easy trick to build one yourself.
What is a LOD?
In it’s simplest form it tells Tableau to aggregate data on a defined level. While usually the Level of Detail is determined by your visualisation (ie. If you look at Sales per Month for each State, your Level of Detail is “Month and State”), with this technique you are able to do a lot of calculations and visualisations which wouldn’t be possible otherwise. To see what it does, have a look at the below table; there are several records for each country and the LOD contains the sum of all records for a given country – for each record of this country. A great breakdown of how to set it up and work with it in Tableau was written by Andy Kriebel here.
Country | Sales | LOD (Sales per Country)
US      |   100 | 150
DE      |   200 | 400
US      |    50 | 150
NZ      |   300 | 300
DE      |   100 | 400
DE      |   100 | 400
How to do it conceptually?
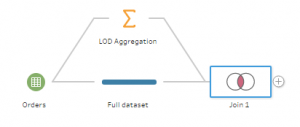
Since there isn’t a formula we can rely on in Tableau Prep, we need to build it from the granular tools which we have access to. What we want to do is,
- keep our existing data set as it is (ie. don’t change the level of detail or filter out things)
- calculate the aggregate values (sum per country in this case) outside of our existing data set
- combine the two resulting data sets into one with one additional column
How to do it in Prep?
First we connect to a data set, I use the Sample Superstore which Tableau provides and add a step behind. This step does not server any purpose for now, it is just the representation of our first requirement (keep our existing data set).

Next, we need to split out a stream from our input tool in order to do the aggregation on a different level. Make sure you do it from the input and NOT after the additional step which we have inserted. Our intention is to create two separate copies of the data which we can manipulate independently for now.


In the configuration pane for the Aggregate step, we set the fields up as below. We tell Tableau to calculate the sum of sales (right pane – Aggregated Fields) per country (left pane – Grouped Fields). The result of this is a data set which has one record per country with the total sales for this country. At this point we already want to rename our aggregated field to “LOD Sum per Country” to make it easier to identify later on.

Now we need to bring the two together again. It is tempting to click on the little “+” next to either of the steps and add a join but Prep has a nice little feature where you can drag and drop elements to connect them. In this case, drag your aggregate tool down to your first step until you see the orange markers and release it on top of “New Join” (NOT New Union).

If you have a look in the configuration, you will see something similar to the screen shot below. Prep should have picked up that you want to join on country (after all it’s the only dimension in your second data set). You will also notice that the total number of records equals the join result; we didn’t filter anything or changed the level of detail for our main data set, so this is what we want to see. If these numbers are different, something went wrong!

If we scroll to the right, we can now see something similar to the initial table on the top of this post. Every country has their record level sales in one column and the sum of all sales in a second column. The sum of sales is the same for each record for a given country. (It doesn’t add up correctly because there is a lot more data which doesn’t appear in the screen shot).

What would I use it for?
You might just leave it as it is and expose it in a Tableau extract for people to use, at this point there is nothing more for you to do than to output the data and publish it on Tableau Server for example.
You could as well use it as a base for other calculations. With the example you will be able to calculate the percentage of one sale of the total sales of a country. You could also use it to calculate how long somebody has been your customer, how many orders they do on average per month since they first became your customer or prepare some churn analysis. There are lot’s of applications, some interesting other ones can be found here
How do I customise this?
This is a simple example but it is very easy to adjust it to your use cases. You will only need to change the level at which you want to aggregate in two places.
- In the aggregation tool (replace “country” with “category” for example
- In the join tool, make sure that Prep joins on the new field as well
You will also be able to define higher or lower levels of detail by adding or removing dimensions from the aggregate tool. SO you could be looking at sales per State per Country by just dragging State into the aggregate tool as well. Again you will need to adjust the join tool, this time by clicking the little “+” next to “Applied join clause” and add the additional dimensions as well.
Technicalities
This method replaces the “{FIXED}” level of detail calculations in Tableau. You will not be able to replace {INCLUDE} and {EXCLUDE} because they rely on information that depends on the graph you create in Tableau. It wouldn’t make sense to try to implement this feature in a tool like prep.
Tableau might or might not also be working on implementing LODs in Tableau Prep. For now they are not available and this is your only way around it. In the future you might be able to replace this workflow with a simple calculated field.
Let me know if you have any questions or interesting use cases how to apply this technique.
In Tableau desktop I am able to use the FIXED function to find the max date for each ID. I see that Tableau Prep doesn’t allow for this type of LOD calculation. I attempted to use the Aggregate work around described above, but selecting MAX only gives me the MAX date for ALL Ids. Is there a way to get this to work for my use case?
Thanks.
Pingback: Table Calculations in Tableau Prep - Curvediscussion