It’s no secret that Tableau Prep Builder and Tableau Desktop share many of the same features. Aggregations, Joins, Pivots, etc are all somehow possible in both tools, even though the purpose and outcome of those are somewhat different in each of them. Some useful tools in Tableau Desktop however didn’t quite make it yet to Tableau Prep Builder. I already described how to mimic LODs in Prep, this is now how to mimic (some) Table Calculations as well.
What is a Table Calculation?
While “normal” calculations in Tableau Desktop only work on a single record, Table Calculations work across any dimension of a table (rows or columns). This makes it possible to “jump out” of the current record, take a birds eye view of the data surrounding this particular record and consider this context for additional information. It enables you to for example calculate differences from one record to another or the relationship between one value to a total; and while you can use this functionality already in Tableau Desktop, you might end up in situations where pre-calculating these values might be beneficial. In particular with Table Calculations, it can get a bit more difficult quite quickly when you try to do several, more complex, calculations at the same time.
While, in theory, you would be able to re-create all of the Table Calculations in Tableau Prep Builder, it can cause significant effort for some of them; because of this I will only cover the ones which I would consider reasonable to implement and explain why others are not further down.
Percent of Total
Let’s assume we want to figure out what percentage of total sales in the southern region of our Superstore data each state contributed. To calculate the percent of total, we need the total sales value across all states in the southern region and the sales value for each of the states. In Tableau language these are two different levels of detail, one at the total level and one at the state level. To get those two numbers, we can conveniently re-use the LOD technique I described last year.

We split the data set into the record level data “State Sales” and an aggregated stream “Total Sales”. In the second one we just aggregate the sales figure to get the total.
Afterwards we join both streams together again to have the “Total Sales” in each of the records. Because we need a common field to join on, in this case I just added a “Country” field with the value “US”
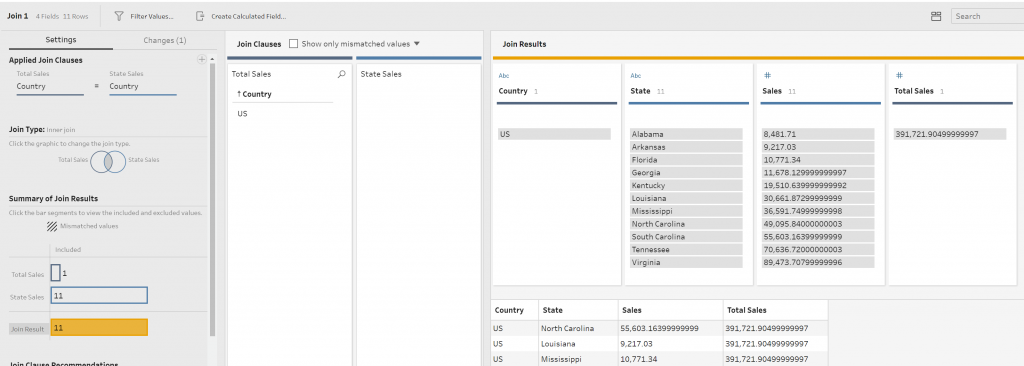
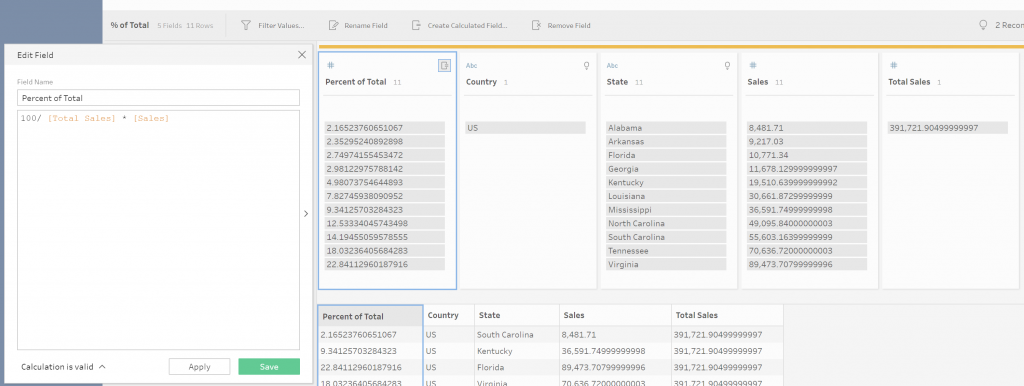
Afterwards the only thing left to do is to actually calculate the percent of total and we are done!
(Percent) Difference
This one is a bit more complicated and actually requires either a suitable data set or some data prep before using Tableau Prep (annoying, I know!). Conceptually, what we need to do is look at a value in a record and compare it to the value in the record before; since we cannot write a formula which looks at values across records, we need to find a way to do it in a single record.

In my (actual example which made me think of this technique) I recorded one of my hikes which gave me an altitude for each of the recorded timestamps. My aim was to calculate the elevation gain, which is really just the difference between the current altitude and the altitude for the previous timestamp. Luckily the app I use adds a running number as an ID for each record which makes it so much easier.
To calculate the difference I need the 1005 from row 1 and the 999 from row 2 in one row so that I can subtract one from the other to see that I went down 6 meters from one observation to the next.
Since we can accurately identify the previous record with a simple formula (record ID + 1), we can bring those two together with a join:
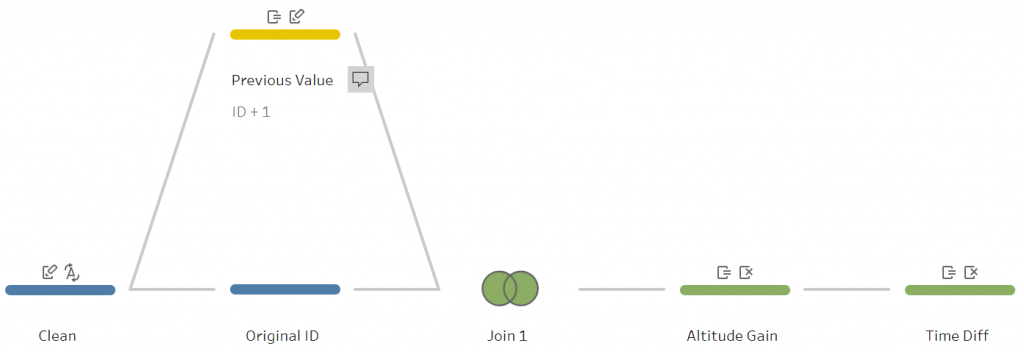

In the “Previous Value” stream I just recreated the ID field with the formula “[ID] + 1”. As you can see, nothing else changed but if I join both streams on ID, I will have the 1005 (ID_prev: 2 – Table 2) in the same row as the actual value 999 (ID: 2 – Table 1).
Below you can see the result of this join. Each actual record ID has now the previous altitude appended to it.
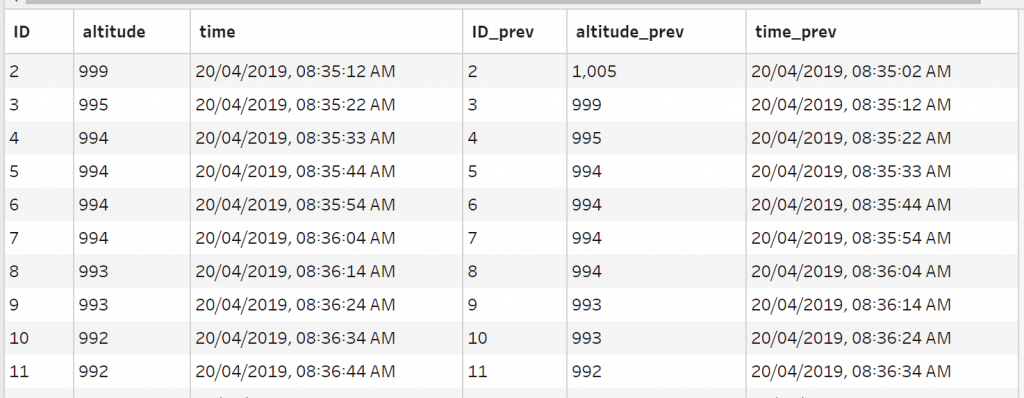
Now I just need to subtract [altitude] – [altitude_prev] and I have my altitude gain from one observation to the next. Similarly for the percent difference, the calculation should be 100 / [altitude_prev] * ([altitude] – [altitude_prev]).
Limitations
This method relies heavily on the existence of a running number as a record ID. Currently it is not possible in Prep to generate it automatically. Therefore this method only works if the data set already has an ID or you will need to add it externally, either manually in an Excel file or possibly with a Custom SQL script in a database connection.
Moving Average
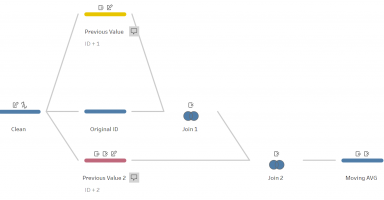
This is one of the calculations for which the effort grows the larger the moving window becomes. Technically it works exactly like the “Difference” calculation; for a moving average of 3 values, we need to bring three values into one record, add them all up and divide them by three. We can reuse the previous workflow and just add an additional stream/join.
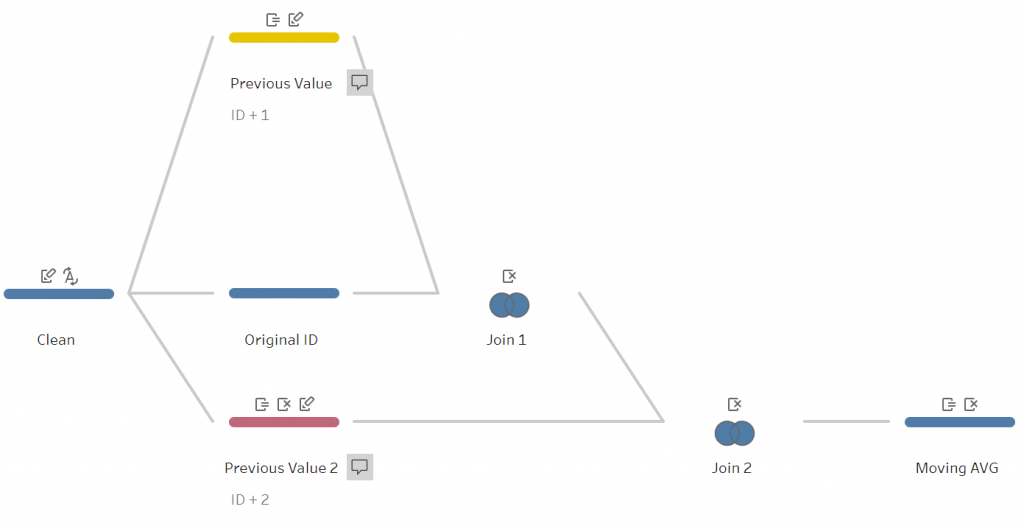
Similarly this can be used to calculate the moving sum, minimum and maximum.
Limitations
The same limitations as for the difference calculation applies, this method requires a running ID to work. Additionally, this method can quickly get out of hand. For a moving average of 4 values, we would need 4 streams/3 joins and an additional pair for each additional value we want to consider. It’s easy to see how this can get out of hand very quickly for e.g. 52 weekly averages. Realistically this method is probably not worth it to do for more than 4 values, as it becomes hard to maintain in case something needs to be changed.
General thoughts
In most cases these calculations can be easily done in Tableau Desktop in an easier, more flexible way. In case it becomes necessary though, these are some simple ways to recreate this functionality. One big problem here is that there is no way to create a running ID in Prep which makes it a lot more difficult. When thinking about solutions to this problem, the first Tableau-esk solution would be the INDEX()/ RANK() functions to define how to partition the data set in order to number the records. These are some basic Table Calculations in Tableau Desktop and could be used to create more complex calculations based on the methods above. An additional idea could then be to add a “Quick Table Calculations” tool to simply apply the above calculations without creating a bunch of join manually.


